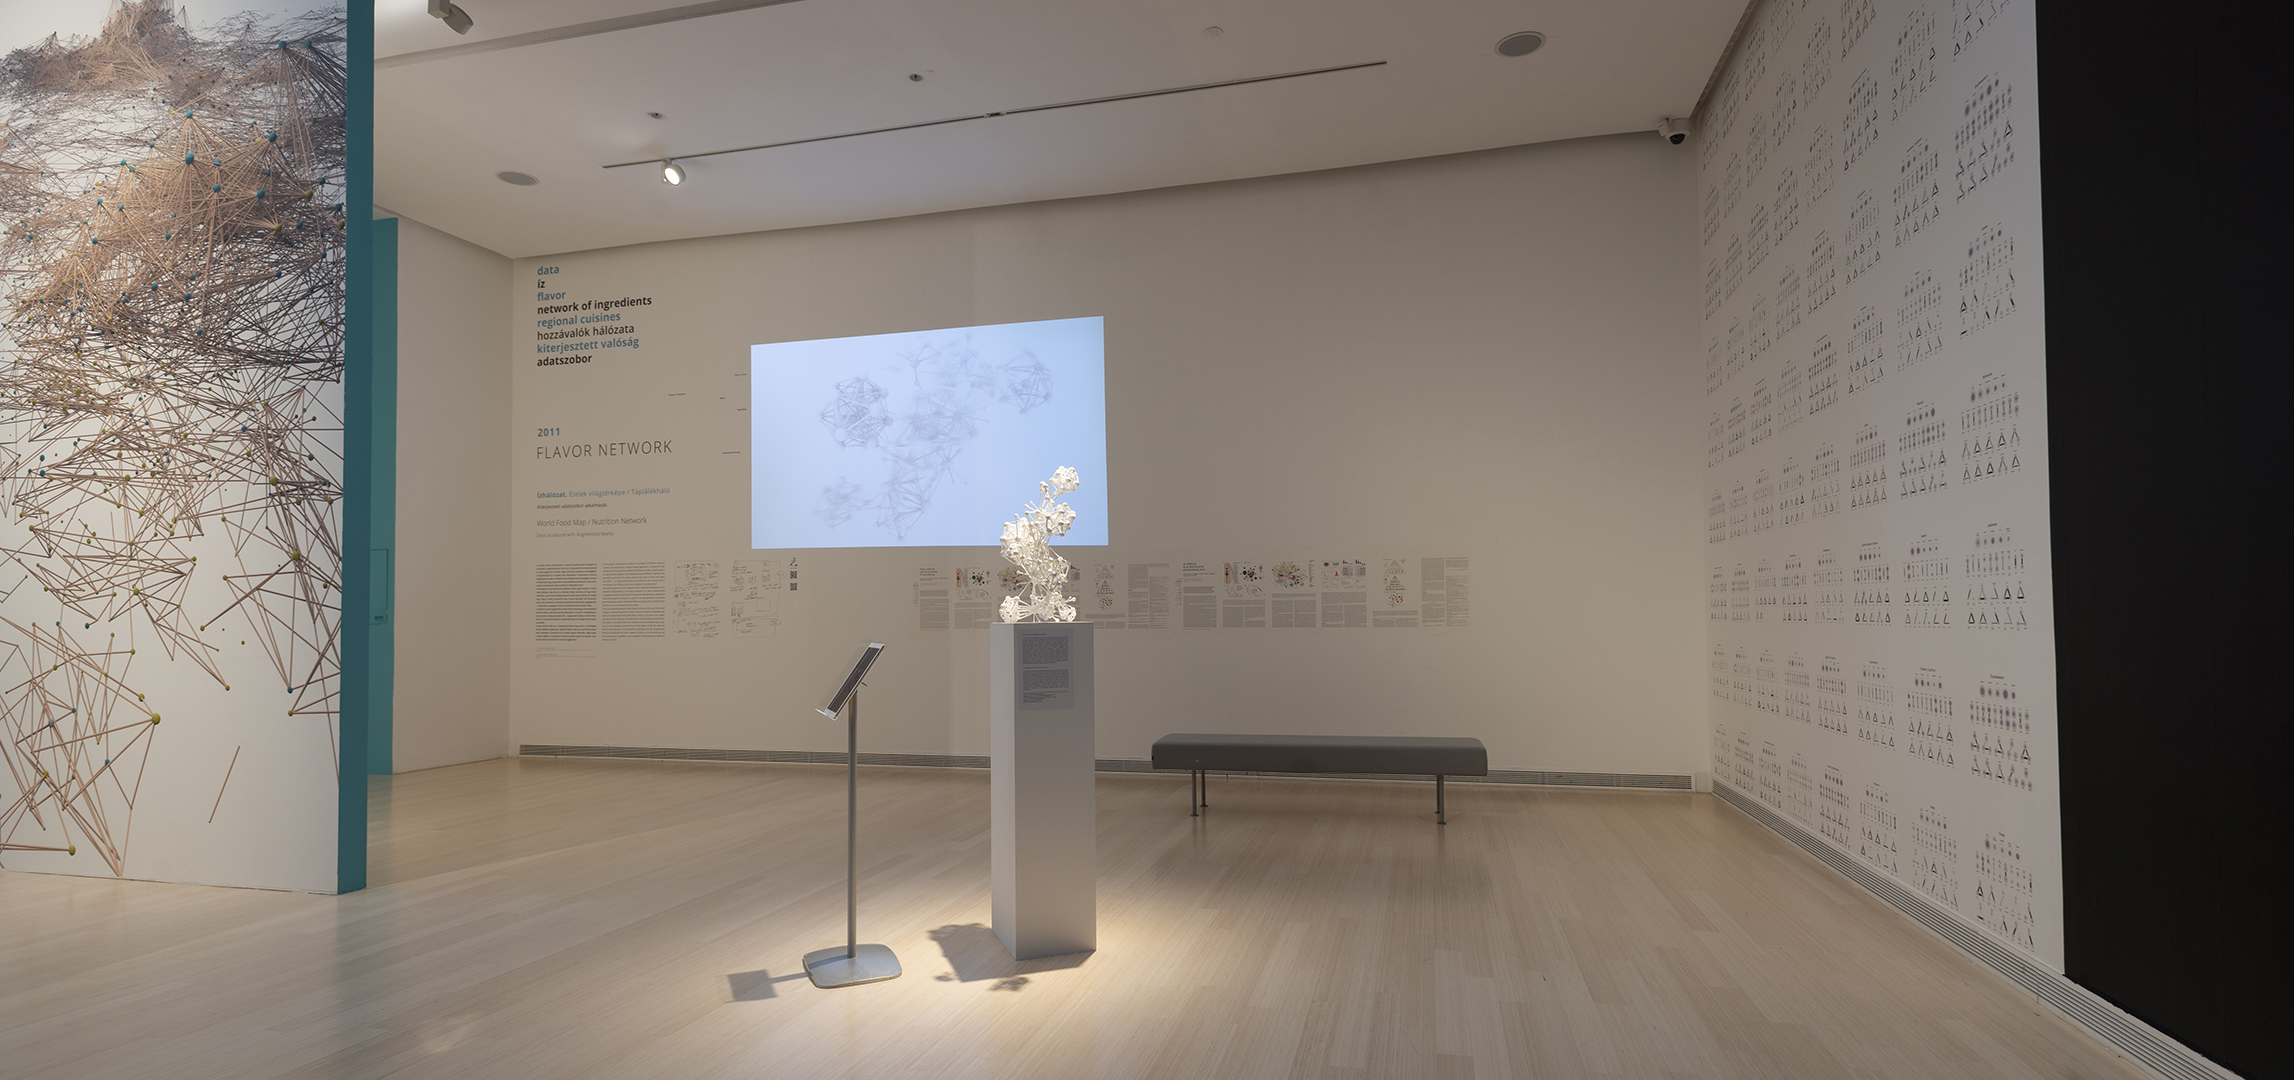
World Food Map / Nutrition Network Data Sculpture with Augmented Reality
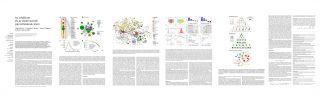
In this project, BarabásiLab looked at the foods of different regional cuisines, and developed a network-based approach, to determine how combinations of ingredients influence the flavor of a dish. Is there a general logic behind traditions and individual tastes? Different cultures have invented a profusion of recipes, and we like some of them and reject the others – so what determines our preference for certain flavour constituents, our liking of particular ingredient combinations?
One of the projections of the network model created by BarabásiLab is the network of ingredients, or, the flavor network. In it, every node denotes an ingredient and its color refers to the type of food it belongs to, and its size shows the number of recipes it is used in. Two ingredients are connected when they share volatile constituens (flavour compounds), and the thicker the link, the more compounds they share.
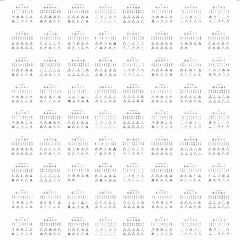
The visual representations of the project include a mid-sized 3D-printed sculpture, representing the first data sculpture created by BarabásiLab. Using an augmented reality (AR) device, visitors can zoom in on nodes, and retrieve their identity and additional visual and textual information. The video on the wall shows the evolution of the exhibited data sculpture, as the computer searched for its final shape. Under the video we find the reproduction of the scientific publication by the BarabásiLab, that first introduced the flavor network. Finally, on the end wall we see the characteristic ingredients and ingredient combinations of different national cuisines.
 BARABÁSILAB: HIDDEN PATTERNS